It looks like you are using an ad blocker. That's okay. Who doesn't? But without advertising revenue, we can't keep making this site awesome. Click the link below for instructions on disabling adblock.
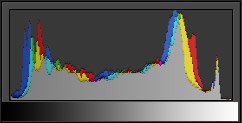
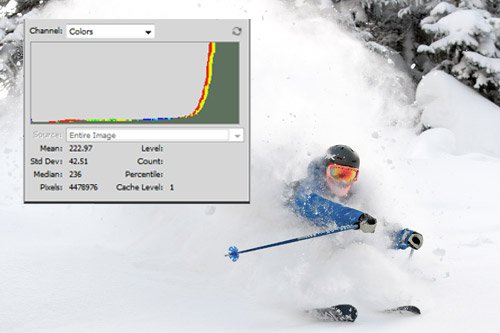
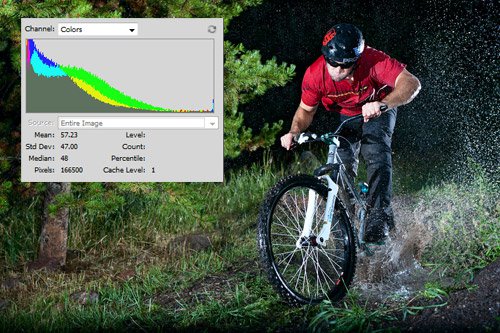
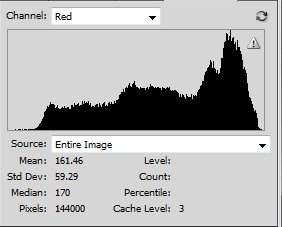
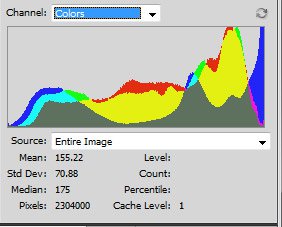
The Histogram is something you can find in almost every digital camera and in every image processing software. It is a graph that helps you evaluate a digital image without even looking at it.The Histogram is a linear scale that has 256 levels and shows relative distribution of light values in the image. The scale starts at 0, which represents the darkest values in the image and goes to 255, which is the brightest pixels or pure white. The height of the line shows the amount of pixels at a specific value. So if you have a tall line on the right side of the histogram, that means you have a lot of bright pixels. If you have a short line on the left side of the histogram means that you have some dark pixels in the image. (example for a bright image histogram)(example for a dark image histogram)All the lines together form the shape of the histogram. What people refer to as a perfect histogram is when the histogram is similar to the "M" letter shape, and it almost touches the ends of the graph. To us there is no such thing as a prefect histogram, because different photos produce different histograms. When shooting or editing, you should refer to the histogram to make sure no areas of the image are clipping (too many overly bright or dark pixels). Clipping occurs when the dynamic range of the scene is too wide and the values are 0 or smaller for the darkest parts of the image and 255 or more for the brightest. If you do see clipping, that means there is no detail in the shadows or highlights, so these parts of the image will be pure black or pure white. If that's the look you are going for, than don't let the clipping bother you.There are a couple different types of histograms, two of which are the most common. The luminosity histogram shows the average brightness values for R(red), G(green) and B(blue) combined. With this histogram you can easily determine how the brightness values are distributed across the image. The other common type is the RGB Histogram that shows an overlay of the colors. That means you can see the different values for the Red, Green or Blue channels.Don't be scared of the histogram, it's a huge advantage to be able to know when details or lost or missing from an image. Use it every time you take photos or edit, and make sure the white snow is not clipping(overexposed) and that you have some detail in the surfer's black wetsuit. If your histogram is leaning more to the left then your image is darker, if it is leaning more to the right then it is brighter.


Comments