NOTE: This article was originally posted on the PeakRankings website on September 28, 2022.
Vail Resorts is now the largest North American mountain resort company in history. The company has made an insane mark on the ski industry, and it now operates a whopping 40 ski and snowboard destinations around the world. But how do the economics of this behemoth conglomerate work? Well Vail Resorts just released their 2022 earnings, and in this piece, we’ll break them down. We’ll dive into the economics behind how Vail Resorts works, how profits have driven some of the recent decisions the company has made, and even how much money it pays to be an executive there.
FY ‘22 Revenue
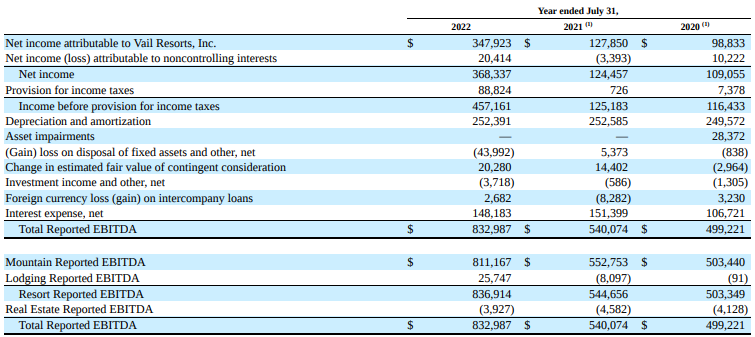
Let’s start with the basics: does Vail Resorts actually make any money? And the answer is: yes, lots. The company generated over $1 billion dollars in revenue from February to April alone, and earned $2.5 billion in the most recently available 12-month period. The business has also consistently been net profitable on an annual basis, netting $368 million in income in Fiscal 2022. However, Vail Resorts’ profitability is seasonal; their fiscal Q2 and Q3 are typically profitable, while their Q1 and Q4 are not.
But wait a minute—aren’t Q4 and Q1 the colder months of the year? Well it turns out Vail employs a technique used by nearly all companies called a fiscal year, where the business can start their calendar on the first day of any month that isn’t January. Vail chooses to start their fiscal year five months early on August 1, so their Q1 and Q4 are actually during the off-season, whereas their Q2 and Q3 take place during the peak winter months in the northern hemisphere.
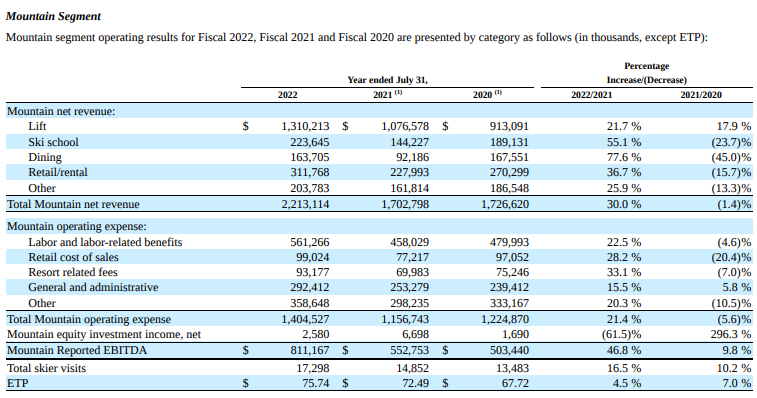
So $2.5 billion dollars is a lot of revenue, but what’s behind the recipe of all this income? Plain and simple, it’s the ski mountains themselves. More than 85% of Vail’s revenue comes from on-mountain operations, including lifts, ski school, dining, and retail, among others, with the percentage being as high as 89% for the 2021 fiscal year. Of the on-mountain revenue, the overwhelming majority comes from lift access products, with the business generating more than $1.3 billion alone from tickets, passes, and other forms of access in fiscal year 2021. Far behind in second place is retail revenue, followed by ski school and dining, with an “other” category making up the other 9% of revenue.
To understand Vail Resorts’ access strategy within the past few years, it helps to look at their lift access product revenue breakdown. For Fiscal 2021, pass products, including Epic season and day passes, generated over 61% of Vail’s total lift revenue. The company saw approximately 17.3 million visitors across its 39 resorts that winter, meaning that the average guest paid an effective ticket price—or ETP—of just $76. That number is wildly below the typical lift ticket prices at Vail’s resorts—even some of the smaller, regional ones—and likely reflects the much better value from buying a pass for those who spend at least a few days skiing per season. What’s wild is the business is still able to stay immensely profitable even with an average visitor price as low as it is, demonstrating that if you buy a 1-day lift ticket for one of Vail’s resorts, you’re really getting the short end of the stick on value. Having such a high percentage of revenue coming from pass products which need to be purchased in advance of the ski season also gives Vail a significant risk cushion, as they already have more than half their revenue in the event of a bad snow year and low visitation. It goes without saying that COVID was an exceptional event here.
FY ‘22 Costs
So what drives Vail Resorts’ biggest costs? Well, the biggest expense its its employees. The resort employed approximately 6,900 year-round employees as of July 2022, as well as 38,000 seasonal employees over the course of the fiscal year. Salaries plus benefits for these workers totaled $690 million across mountain and lodging segments for Fiscal 2022.
Next up is general and administrative expenses, also known as G&A, which include costs of doing business such as rent payments, utilities payments including those required to power the ski resorts, and marketing costs, among other things. These costs totaled about $347 million for Fiscal 2022, or just over half of what Vail spent on its employees. The company also has a hefty $449 million “other” section for its operating expenses; this cost isn’t fully broken down, but it does include expenses related to acquiring and integrating new resorts over the years. But perhaps the reason the expenses in this section are so huge are that they also include discretionary investments, such as lift and terrain expansions, which have been ongoing at multiple Vail-owned resorts for years. Remaining expenses include those related to retail cost of sales, such as credit card processing fees and processes needed to prep products for purchase, and resort-related fees, such as permit and lease payments.
Annual Trends
Now let’s talk about annual trends, and there have been some significant ones, given the particularly bumpy past few years for the travel industry. A zoom-out to four-year revenue numbers shows that 2022 was a significant recovery period, with Vail Resorts seeing a nearly 200% year-over-year increase in net income and 54% increase in EBITDA. Fiscal years 2021 and 2020 were still profitable, but they saw significant revenue dips due to COVID. In fact, Vail’s profit margins dropped by more than 60% during the COVID years versus 2019, the last non-COVID-impacted fiscal year. However, Vail’s EBITDA, which is generally accepted as the best picture of a company’s earnings potential by excluding certain capital costs that don’t paint a picture of future profitability, saw significantly lower changes through COVID, only dropping by about 30% from 2019.
In Fiscal 2022, Vail Resorts’ operating margin was 14%, much improved from the approximately 6% margin during the COVID years, and much closer to their 2019 margin. For reference, typical large public corporations had profit margins of around 9-13% during this time period, with the most recent average being around 12%.
Segment-Level Revenue Trends
At 61%, the share of total Fiscal 2022 lift revenue derived from pass products was unchanged from Fiscal 2021, and approximately 10% higher than in Fiscal 2020 and 2019, when it was about half of revenue in this segment. The steady share of pass product revenue here, even after 2021’s numbers were inflated by deferrals, demonstrates that Vail has been effective in pushing pre-season pass purchases for resort access.
Vail Resorts also saw significant—but not exactly full—recoveries in other revenue areas. The company saw a 37% increase in retail and rental revenue from Fiscal 2021, although the revenue in this category was still 3% lower than in Fiscal 2019. Dining revenue was also up substantially, increasing by a whopping 78% from 2021; however, this segment was still plagued by some access restrictions last winter, and once again, this segment didn’t make a full recovery from 2019, still seeing a 13% drop from that year. With all COVID-related dining restrictions removed for the 2022-23 season, we wouldn’t be surprised to see a full dining revenue rebound for Fiscal 2023.
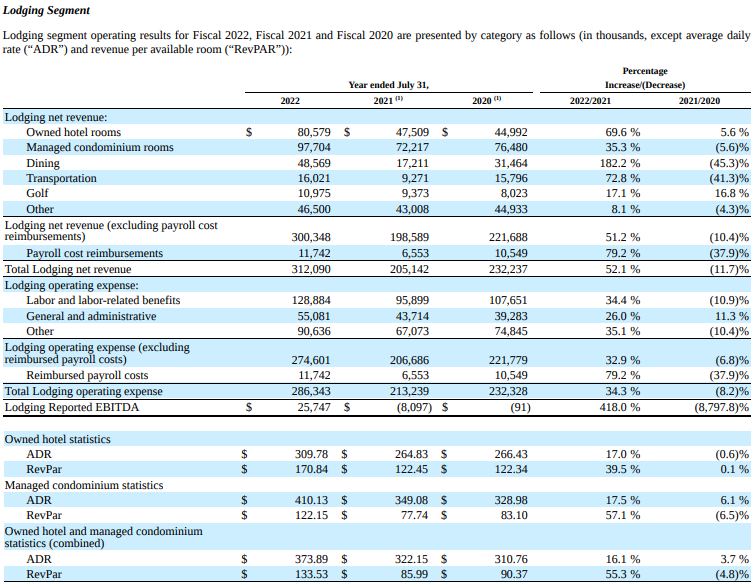
One place where Vail saw a full rebound from the peak of the pandemic was in lodging. The business went from a net negative lodging EBITDA in Fiscal 2021 to a 8% operating margin in this category for Fiscal 2022—which, while lower than the company’s overall EBITDA to revenue margin, was still quite healthy. This was driven in large part due to the business’s ability to fill many more hotel rooms than in the COVID years; the resort’s revenue per total available rooms—or RevPAR—increased by more than 55% compared to Fiscal 2021. In addition, room prices increased by 16% vs. 2021, and 20% vs. 2020, allowing the business to generate more revenue from each stay. All in all, total net revenue increased by 52% vs. the previous fiscal year.
Expense Trends
Vail also significantly increased its operating expenses for Fiscal 2022. Costs increased across the board, with each segment across mountain and dining seeing expenses rise by anywhere between 15 to 35 percent vs. Fiscal 2021. Especially of note was a 20% increase in the “other” expenses category, which likely reflects some of the capital investments, such as Breckenridge’s Freedom SuperChair and Beaver Creek’s McCoy Park, that were completed last fall, as well as the numerous lift projects that started this summer. However, some of these expenses, such as retail cost of sales, resort-related fees, and lodging labor, still didn’t quite reach the level they were at in pre-COVID Fiscal 2019; these circumstances once again reflect that a full recovery hasn’t manifested in some sectors.
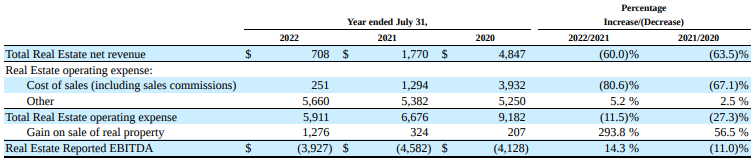
One area where Vail hasn’t been net profitable for years is in real estate. This segment involves selling either land or properties to other people or businesses, rather than renting them out for temporary vacation stays. Real estate net revenues did slightly outnumber cost of sales for Fiscal 2022, but significant operating expenses, including G&A costs and labor benefits, resulted in an EBITDA that was underwater. That said, at just -$3.9 million, the negative profit in this segment is barely a blip on Vail’s overall margin.
Balance Sheet
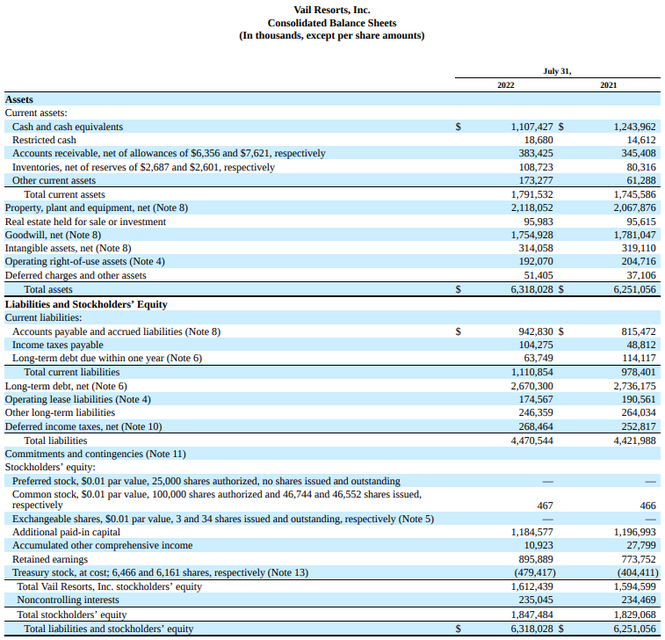
With much of its revenue dependent on leisure, discretionary activities, Vail operates in a high-risk industry. But if their revenue were to suddenly dry up, would Vail immediately run out of money? Nope. Turns out they’re sitting on over $1.1 billion dollars in cash, which is a slight but minimal decrease from last year. Vail’s current assets, or assets that are expected to convert into cash in the short term, totaled $1.8 billion as of July 2022; its current liabilities, or amount due to creditors in the short term totaled $1.1 billion. This gives Vail Resorts just under $700 million dollars in working capital, or money that’s practically usable for operating purposes.
Given these circumstances, Vail would have to lose a substantial amount in revenue—or incur astronomical expenses—to go under.
Executive Compensation
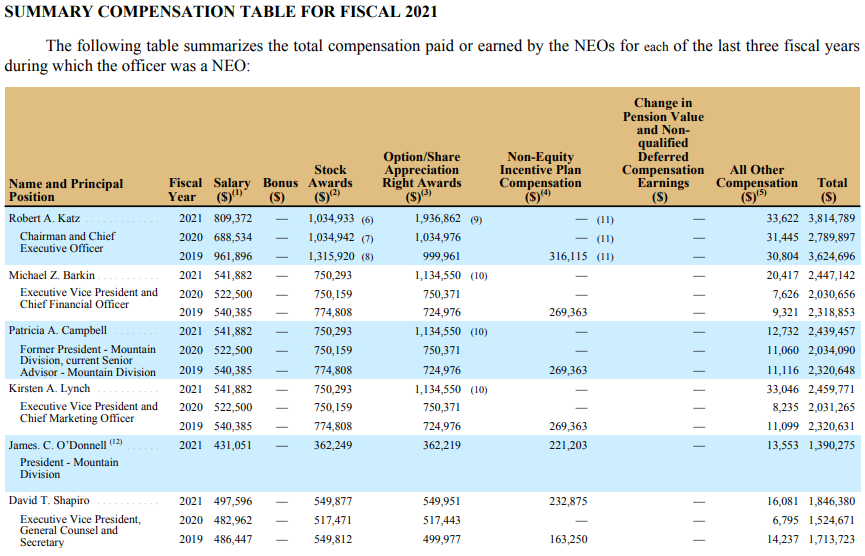
So Vail makes a lot of money, but how much of that translates to their executives’ salaries? Turns out, quite a bit. At least that’s what we can tell from Vail’s 2021 Proxy statement—their 2022 compensation numbers won’t be out for a few more weeks.
Vail might be raising its minimum wage to $20/hour next season, but its C-Suite—or executive-level management team—has always made astronomically more than that. For the 2021 fiscal year, every Vail Resorts executive officer made over $1 million dollars in total compensation, with a sizable chunk of that compensation coming from stock awards on top of a high six-figure base salary. In his final year as CEO, Rob Katz made over $3 million in total compensation. Even in COVID-riddled 2020, he made just under $2.8 million in total comp. Kristen Lynch, who recently earned the promotion to CEO to replace Katz, still made over $2 million each year when she was Chief Marketing Officer.
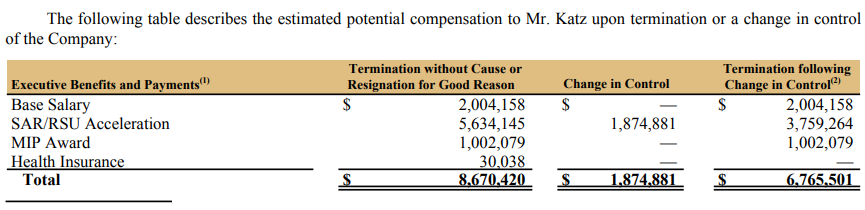
But what about if any of these execs leave the company? Turns out, they have some pretty cushy exit packages. If Rob Katz leaves Vail Resorts upon certain terminations of employment, including certain resignations for “good reason”, he’s entitled to up to $8 million in total compensation severance. The other C-suite members are also entitled to severance packages of over $500,000.
It also turns out that due to financial reforms passed in 2010, Vail Resorts has to provide the ratio of the total salary compensation for their CEO to the salary compensation for their median employee. As of July 31, 2021—the most recently available date—that ratio was 94:1, when annualizing seasonal workers’ salaries, which were a median of $40,000 at the time. However, Vail Resorts is far from the worst offender in this category. The median Fortune 500 company pays its CEO 318% more than what Vail Resorts awarded, and has a CEO to salary ratio of 193:1, or more than double what Vail Resorts’ was. For an extreme example, Amazon’s ratio is over 6,000:1.
Final Thoughts from PeakRankings
So while some may have grievances against Vail Resorts for increased crowds at its resorts, corporate-feeling mountains, or just due to its sheer size, the company is one of the most successful out there, boasting an incredibly profitable operating model and building a war chest to expand even further in the coming years. Vail Resorts has also become a leader in expanding a $20/hour minimum wage, something that’s still incredibly uncommon in the Fortune 500 world. The company does face some fundamental risks due to the nature of the industry they’re operating in—and they’ve had some high-profile operational blunders over the past few seasons—but when it comes to the fundamentals of running a business, they know what they’re doing, and they do it well.
We hope this article helped you understand the economics behind Vail’s business strategy and why it operates the way it does. Is there anything else we should have covered in this piece to tell the Vail Resorts story? Let us know in the comments below!
For more information on Vail Resorts mountains, see our Epic Pass mountain reviews as well as our Colorado, Tahoe, Utah, Vermont, Washington, and Western Canada rankings.
Ⓒ2022 Peak Rankings LLC, All Rights Reserved.
Comments